Blog
The latest updates and insights from BIChart

BIChart at Fabcon 2026 Recap
BIChart Fabcon 2026 was an important show to learn, connect, and network with the community. Here is our recap.
Planning Microsoft Copilot and Fabric Data Platform Success
Microsoft Copilot and Fabric together drive wider AI / BI adoption. Business business productivity is up for grabs. Microsoft is positioned as a leader.

BIChart Fabric Migration meet up at FABCON
BIChart is connecting customers, partners, and experts doing Fabric migrations at Microsoft FABCON 26
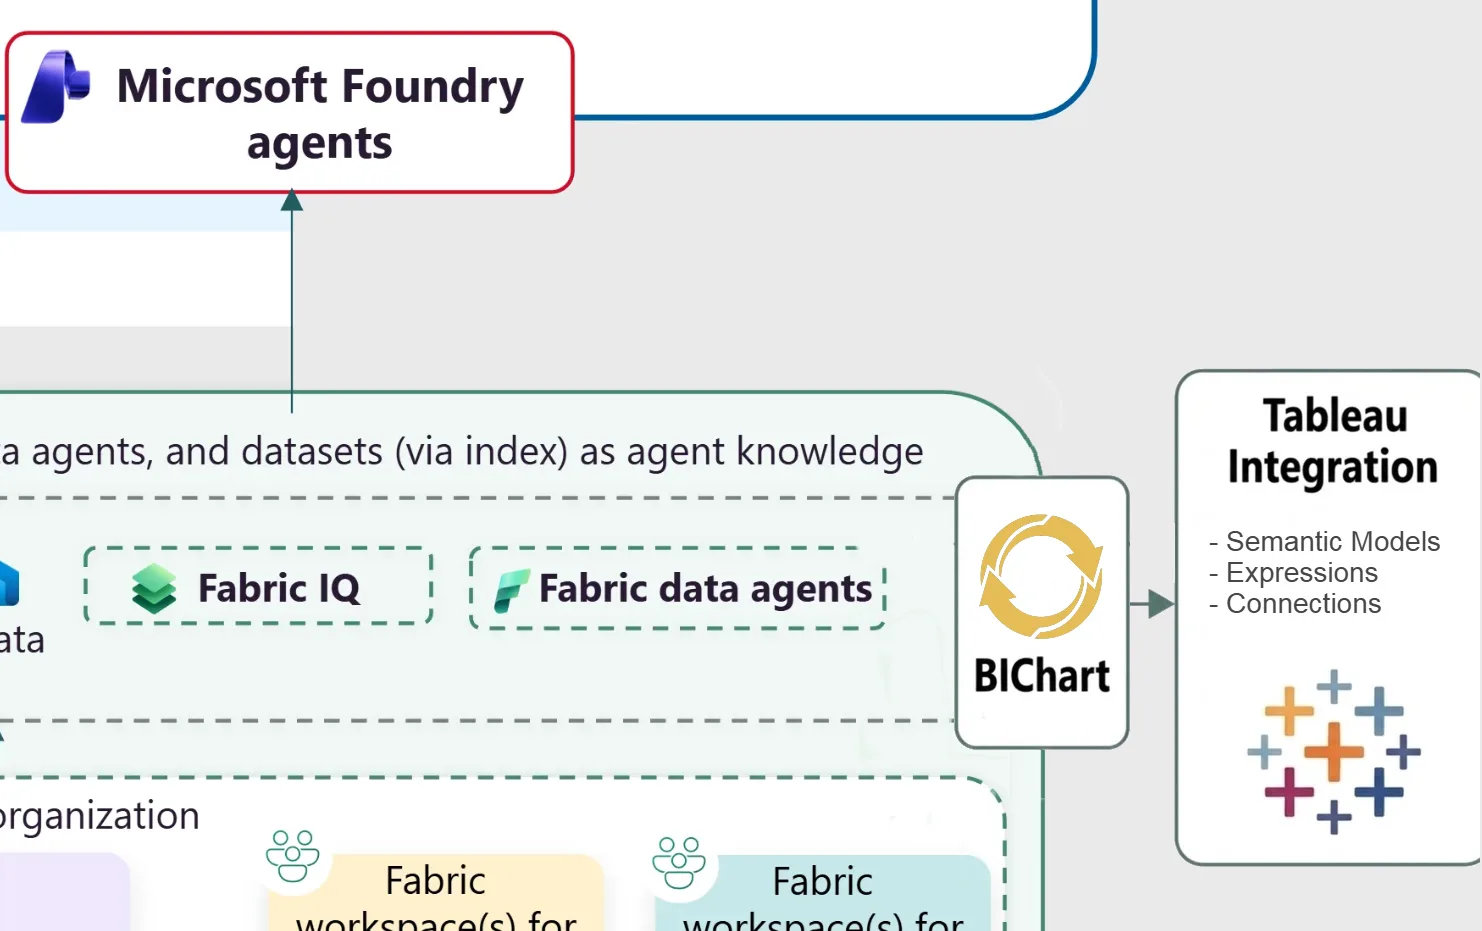
Migrating Tableau to Fabric Semantic Models with Git and Power BI MCP
Migrating Tableau to Fabric Semantic Models with Git and Power BI MCP. Set yourself up for success.

BIChart for Public Sector is Now Available Through Carahsoft
BIChart Tableau to Power BI migration tools are now available to U.S. public sector organizations through Carahsoft Technology Corp., The Trusted Government IT Solutions Provider®.

The UX Side of BI Migrations: Moving Hearts, Not Just Data
Migrating from Tableau to Power BI is moving habits, muscle memory, and the mental models people have built around their work.

Cost Avoidance: An Impactful Case for Power BI Consolidation
From Analytics Sprawl to Strategic Focus: Why Enterprises Are Consolidating on Power BI while emphasizing cost avoidance.
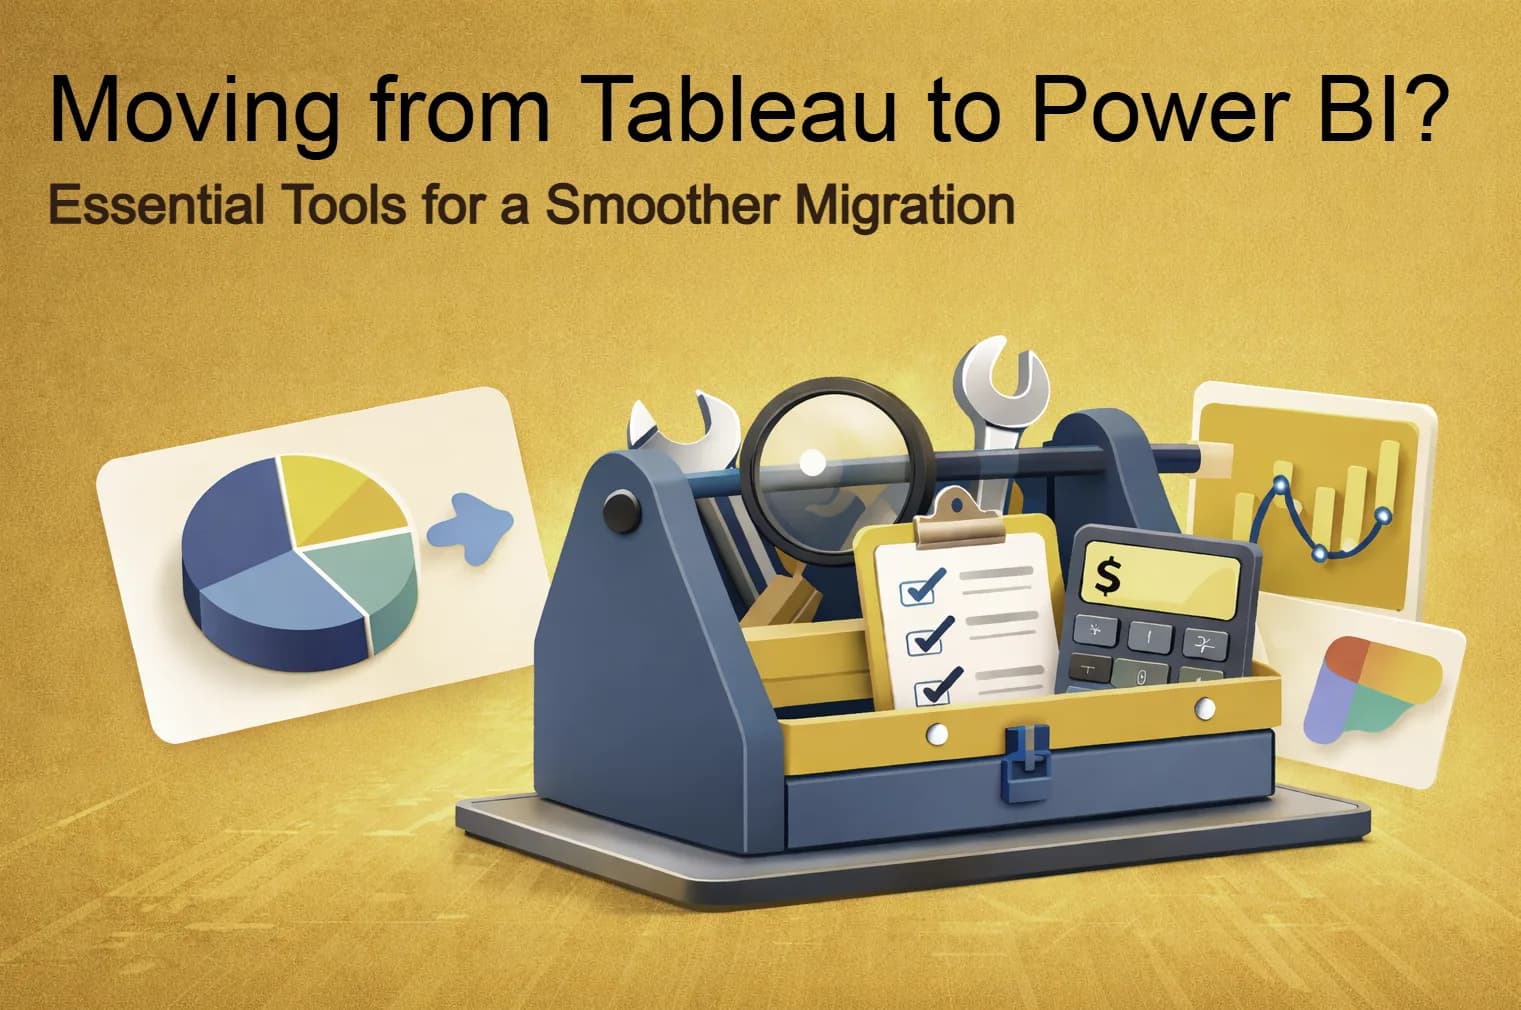
Free Resources to Plan BI Migration from Tableau to Power BI
Free resources and guidance to plan BI Migration alignment and execution. Learn ricks to de-risk migration from Tableau to Power BI needs a good plan.

Supercharge your Power BI Tables and Matrix with Inforiver
In this article, we take a deep dive into Power BI Tables with Inforiver as the premium tabular reporting and data viz solution.

Simple Tableau Inventory Tricks for Archiving and Cleanup
In this article, we will explore simple, free tactics for a basic Tableau Inventory and cleanup.

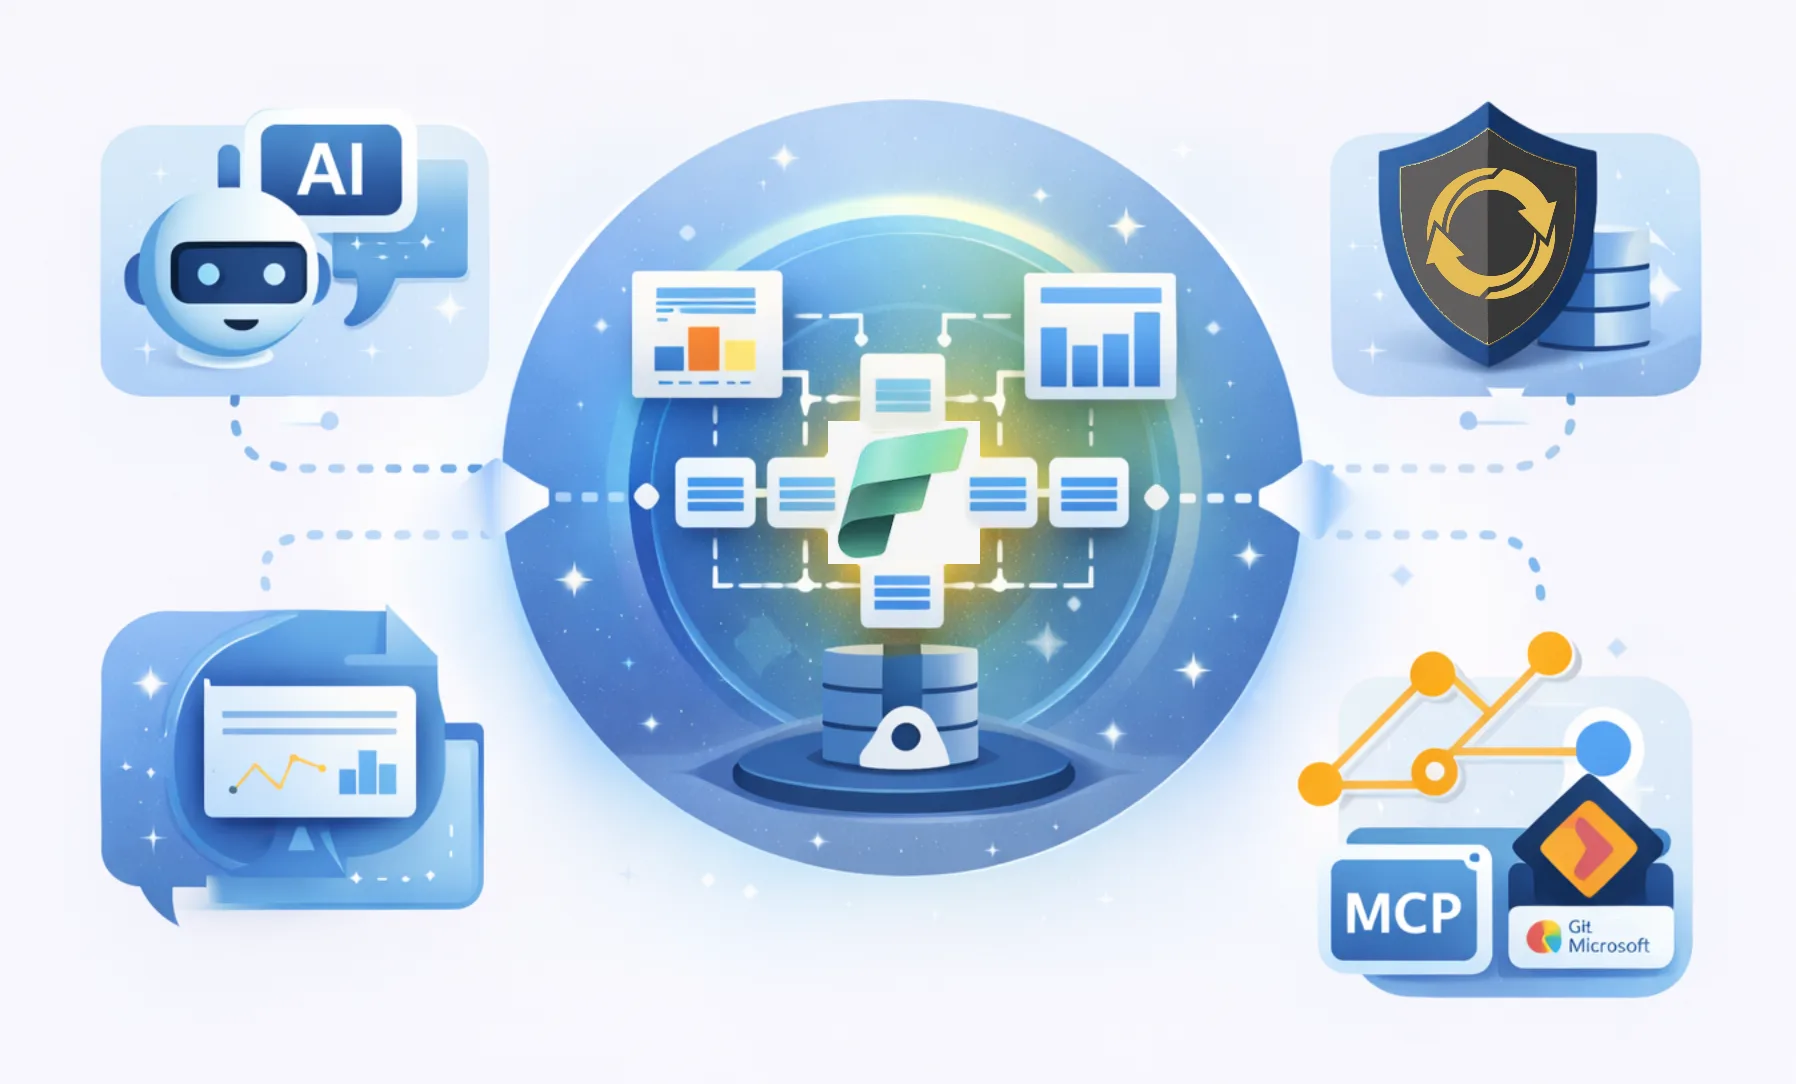
Microsoft Ignite 2025 : Fabric IQ, MCP, and the Future of Modern BI
Microsoft Ignite delivered a clear vision and tools like Fabric IQ, signaling a clearer path for enterprise AI / BI adoption.

BIChart Case Study: FundCanna Prepares for the Future of AI-Driven Analytics
FundCanna journey to AI / BI included an assessment of their current BI Platform, Tableau, with BIChart.

Why You’re Overpaying Migrating from Tableau to Power BI
Many BI teams migrating to Power BI underestimate that the real cost isn’t the licenses—it’s the lost time and resources spent chasing a perfect star schema before delivering any insight.

Tableau Migration Checklist
Our BIChart Tableau Migration Checklist is designed to help you plan your migration to a new BI platform.
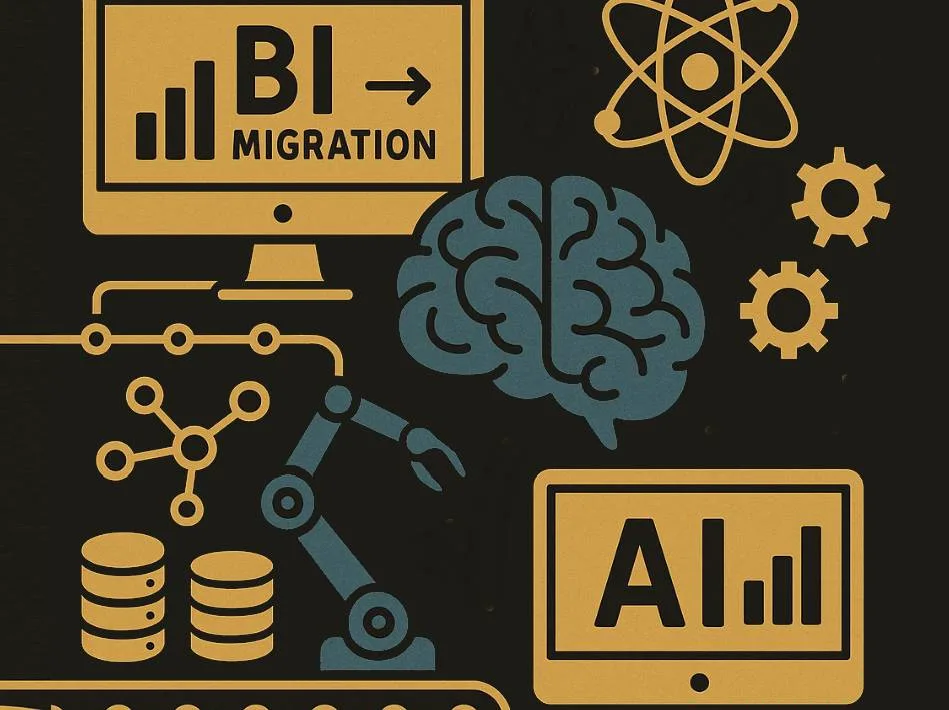
Why Enterprise BI Migration and Consolidation is Increasing
BI Migration and consolidation initiatives are growing. Learn what is driving this trend and what enterprise leaders are saying.

BIChart V3: Nine Months of Relentless Innovation
BIChart V3 delivers bulk migrations at scale plus support for any visual, data source, published sources, parameters, and live or extract connections with automated DAX and visual conversions. Nine months in, this is only the beginning.

BIChart Achieves SOC 2 Type 2 Compliance
BIChart is SOC2 Type 2 compliant, and is one example of our commitment to security, trust, and transparency.

Tableau to Power Power BI Migration Cost Calculator
Tableau to Power BI migration cost calculator was created to visually communicate and analyze your total level of effort and resources

BIChart Now Available on the Azure Marketplace
BIChart migration suite is now officially listed on the Microsoft Azure Marketplace. Automate Tableau to Power BI conversion.

Tableau vs. Power BI Pricing in 2025: Demystifying the Costs
2025 Pricing Comparison for Tableau vs Power BI for standard and enterprise.

Power BI Migration Accelerator with BI Chart
A Power BI Migration Accelerator from Tableau to Power BI with a click of a button requires a careful blend of technical and business analysis expertise.

Tableau Archive Analytics: Data driven Tableau Adoption Tracking
Learn how a Tableau archive process that is data-driven will help uncover overlapping efforts and reduce redundancy.

Finding Tableau Semantic Model Disconnect: Redundant Work
Tableau semantic model disconnect is a problem that creates duplicate work. Learn how to solve chaos in Tableau.

Why Fabric Semantic Model Is the Missing Link Multiple Versions of Truth
Every enterprise experiences the same “multiple versions of truth problem.” Learn how Fabric Semantic model is the missing link.

Power BI vs Fabric: One Step into the AI Era
Power BI vs Fabric is top of mind as Microsofts unified platform is accelerating its way into AI. Learn how this impacts you.

Challenges of Moving from Tableau to Power BI
Explore 4 key challenges of moving from Tableau to Power BI to consider for planning your migration success.

Enterprise BI Consolidation: Putting your metadata to work
Why enterprise semantics, metadata and lifecycle management are key assets to consider during consolidation. Enterprise BI consolidation initiatives are gaining serious momentum across many industries. As we reach the midpoint of 2025 we are seeing more enterprises accelerating efforts to move away from siloed, duplicative analytics environments. There will be winners and losers in this []

Tableau Assessment for Migration
Before any successful Tableau migration or consolidation can begin, there’s one critical step that starts with a Tableau assessment. It’s the difference between a smooth transition and a chaotic, costly mess. Why Run a Tableau Migration Assessment? A Tableau migration assessment helps you gain clarity on what’s in your environment and what should be migrated []

Tableau to Power BI Migration: An Analytics Leader Complete Guide
BIChart has compiled guidance from analytics leaders how to pan and execute a Tableau to Power BI migration.

Tableau vs Power BI: What Has Changed in 2025
Tableau vs Power BI is a topic that has dominated social media for many years. In 2025, comparing Tableau to Power BI is like comparing Coke and Pepsi. Both products accomplish the same goal to turn data into Tabular reports and interactive dashboards. Looking at Gartner Peer Insights, we see that both products are almost []

Tableau Next: Salesforce is Doubling Down on Agents
At the recent Tableau Conference 2025 in San Diego, Salesforce unveiled Tableau Next, marking a significant evolution in data analytics. This new platform integrates deeply with Salesforces ecosystem, emphasizing AI-driven insights and a renewed focus on semantics to make analytics more actionable. Introducing Tableau Next: Agentic Analytics Tableau Next introduces a suite of AI-powered agents []

Power BI Price Increased: Why it Won’t Slow Down Adoption
In April 2025,Power BI price increased 40% from $9 to $14 per user. This marks the first increase in 10 and sets a still reasonable price point in-line with other solutions. Power BI Premium Per User (PPU): Rose from $20 to $24 per user per month (a 20% increase). Despite the recent price increases for []

Why I Started BIChart: Revolutionizing BI Migrations with AI
Discover how BIChart is using AI to automate migrations from Tableau to Power BI. Here, I share why I built BIChart and what the future of BI looks like.

Fabric Conference 2025 Recap: High Energy with Jam-Packed Sessions
The Fabric Conference #FabCon was an incredible opportunity for the BIChart team to witness firsthand the evolving state of data, analytics, and AI

Why Enterprises are Migrating to Microsoft Fabric
Enterprises are migrating to Microsoft Fabric because it brings together data engineering, analytics, and business intelligence into a single platform. Fabric simplifies how data is managed, reduces tool sprawl, and makes it easier for teams to deliver insights across enterprise lines of business. Here are 3 common themes we are seeing as we migrate enterprises []